


13 Oct The Great Divergence
Posted at 14:59h
in INSIGHTS
Source: Bloomberg, 28/09/26
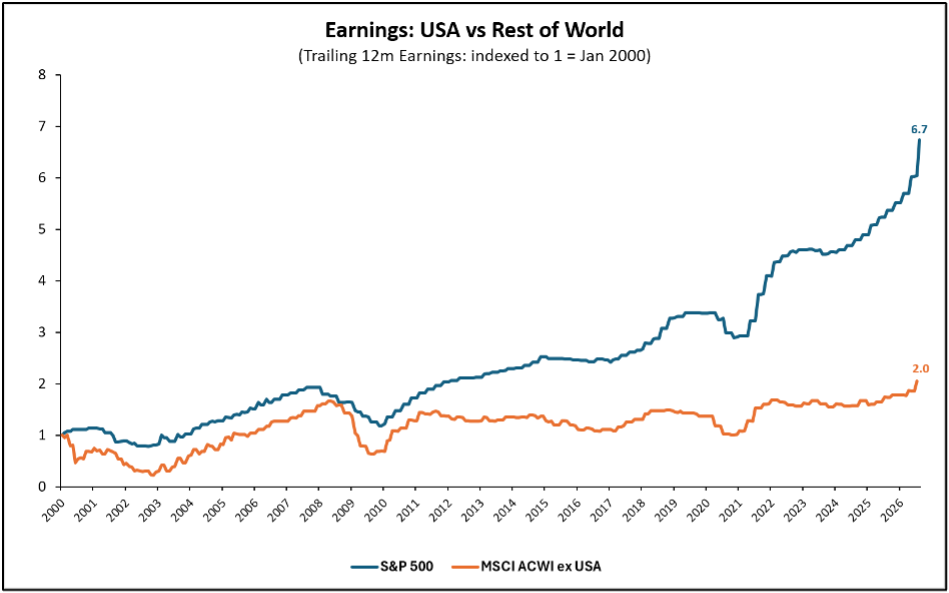
Since the turn of the millennium, earnings in the US equity market have risen almost sevenfold, while those of the global ex-US market have merely doubled. Today, the divergence has never been wider in the history of this series. So, what drove this US earnings engine?
The gap widened in two bursts, with the first beginning in 2011. For nine years afterwards, earnings outside the US struggled to gain ground, while the US almost doubled. Higher productivity growth, a larger technology sector, greater innovation, and the corporate tax rate cut in 2018 all helped lift earnings higher in the US. Elsewhere, Europe lurched through a debt crisis, and from 2014 the ECB moved rates into negative territory, adding pressure to bank profitability. This mattered because Financials make up a much larger share of ex-US equities. Additionally, the China-fuelled commodity boom turned to bust, hitting miners and oil producers.
Following the pandemic shock, digitalisation accelerated and the second burst began in 2021, where AI added another gear. Over five-years, US earnings have more than doubled again. America’s position at the centre of the AI build-out helps explain this. The AI boom is centred on American companies: the US has more data-centre capacity, running or planned, than the next 14 countries combined. In 2026, approximately $800 billion is expected in capital expenditure by the largest US hyperscalers, and Goldman Sachs estimates that almost half of 2026 S&P 500 earnings growth is coming from AI investment.
A growing gap creates a reinforcing cycle. High returns generate cash to fund research and development (R&D), R&D reinforces market share, scale supports margins and cash flow, and cash flow funds the next investment cycle. The US listing environment further reinforces the flywheel through deep markets and access to capital, while attracting and retaining many of the world’s most successful companies. Eight of the ten largest publicly listed companies by market capitalisation are US-listed.
How much of this is reflected in the price? A good deal. On a trailing 12-month P/E basis, the S&P 500 currently trades at a 42 percent premium to the rest of the world, but still below its 10-year average of 51%. That does not necessarily make the US market expensive: structurally superior earnings can justify a higher multiple.
At High Street, we continue to find value in selected US businesses, reflected in our sizeable allocations. However, this value sits in certain pockets of the market identified through our investment processes. Our preference remains owning quality businesses with robust balance sheets, consistently high returns on capital, and resilient free cash flow generation, which are attractively priced given these fundamentals.